Example: Evaluation of Simulated Data
On this page we explain how to evaluate measured positions of Mercury on the solar disc if one have found simultaneously taken pictures and/or measurements of a distant participant (here, in order to get an angle of parallax as large as possible): Montreal, Canada (φ=45.3°, λ=-73.48°) and Ushuaia, Argentina (Tierra del Fuego) (φ=-54.8°, λ=-68.3°). The simulated measures have been calculated by using the (Windows-) program eclipses (or its German version Finsternisse).
-
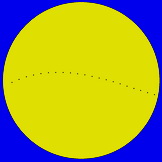
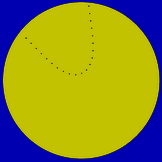
The pictures have been taken with an azimutal mounted camera every 15 min (12:45 - 18:00 UT). Superimposing of the pictures yields the following results:
k.bmp) |
k.bmp) |
| Montreal | Ushuaia |
-
By rotating the images so that the direction east-west is horizontal, for instance by evaluating double exposed images with the (Windows-) program evaltransitpicts, by determining the angle of rotation with it and by superimposing the rotated images one will get the results like the following:
k.bmp) |
k.bmp) |
k.bmp) |
| Montreal | Ushuaia | Superposition Montreal/Ushuaia |
-
During the evaluation of the single or double exposed images the program evaltransitpicts can also display the positions of Mercury with respect to the solar disc and store them into a text file. These positions may be filled into the Excel sheet tableofMercurypositions2019.xls which will yield the sheets tableofMercury2019positionsMontreal(sim).xls and tableofMercury2019positionsUshuaia(sim).xls
-
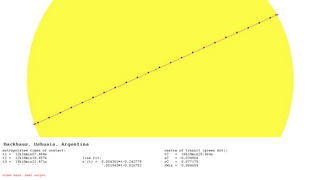
Single pairs of simultaneous positions may be evaluated with the (Windows-) program calcparallax2019 or with the Excel sheet comp2Mercury2019positions.xls. For 13:45:00 UT, for instance, you will find in the sheets:
| Montreal | Ushuaia |
|---|
| x' | -0.587132 | -0.584450 |
|---|
| y' | -0.176941 | -0.171581 |
|---|
When you fill these values together with the geographical coordinates of the cities into that program or that sheet (the parameters of the sun and the 0:00 UT sideral time of Greenwich of the transit day are preset) you will get the following measure of the solar parallax: πS=8.3".
-
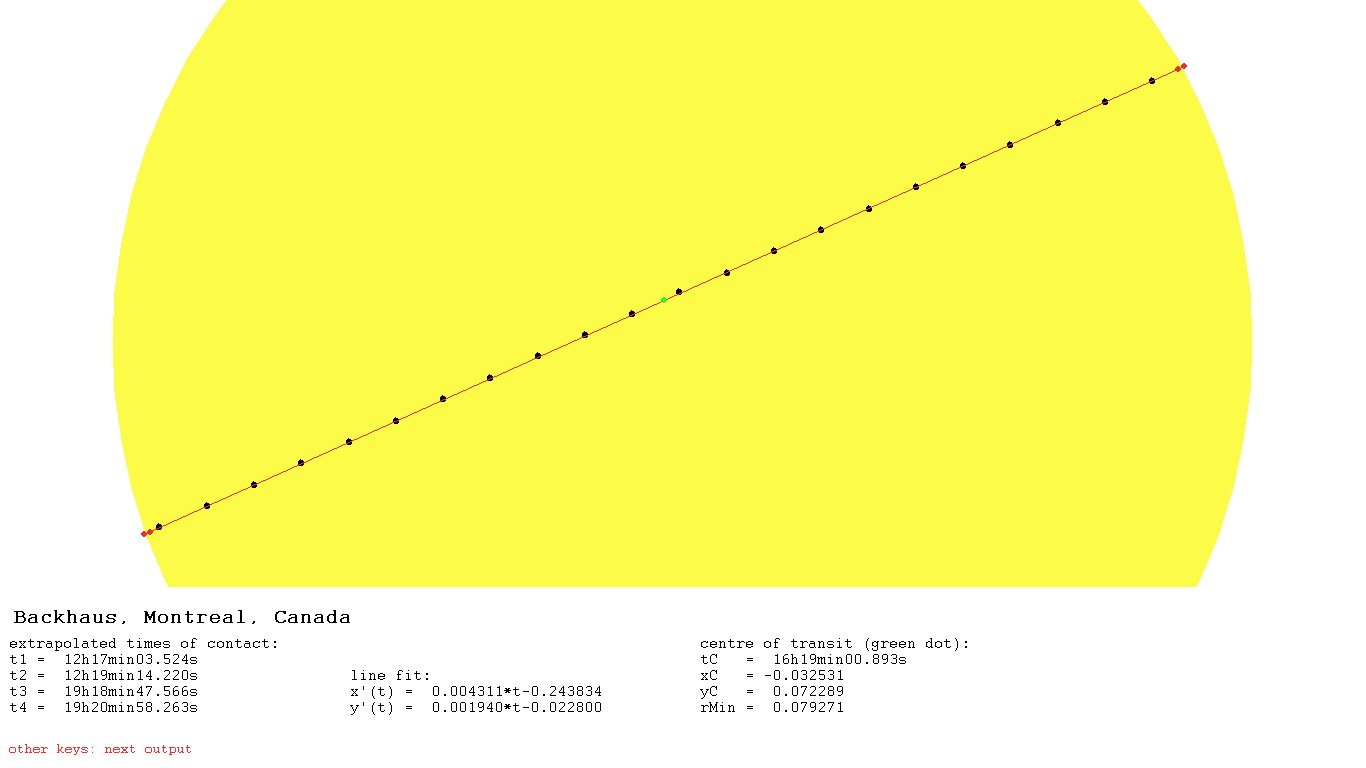
If you save the sheets as tab-separated text files these files may serve as inputs for the (Windows-) program comptransitofMercury2019pos which will display diagrams of the position values, calculate line fits to them and calculate improved values of the solar parallax by averaging (a) the measures of all exactly simultaneous position measurements and (b) the quarter hour values of the line fits. The latter will be possible without any simultaneous measurements!
 |
 |
k.jpg) |
Simulated position measurements
from Montreal |
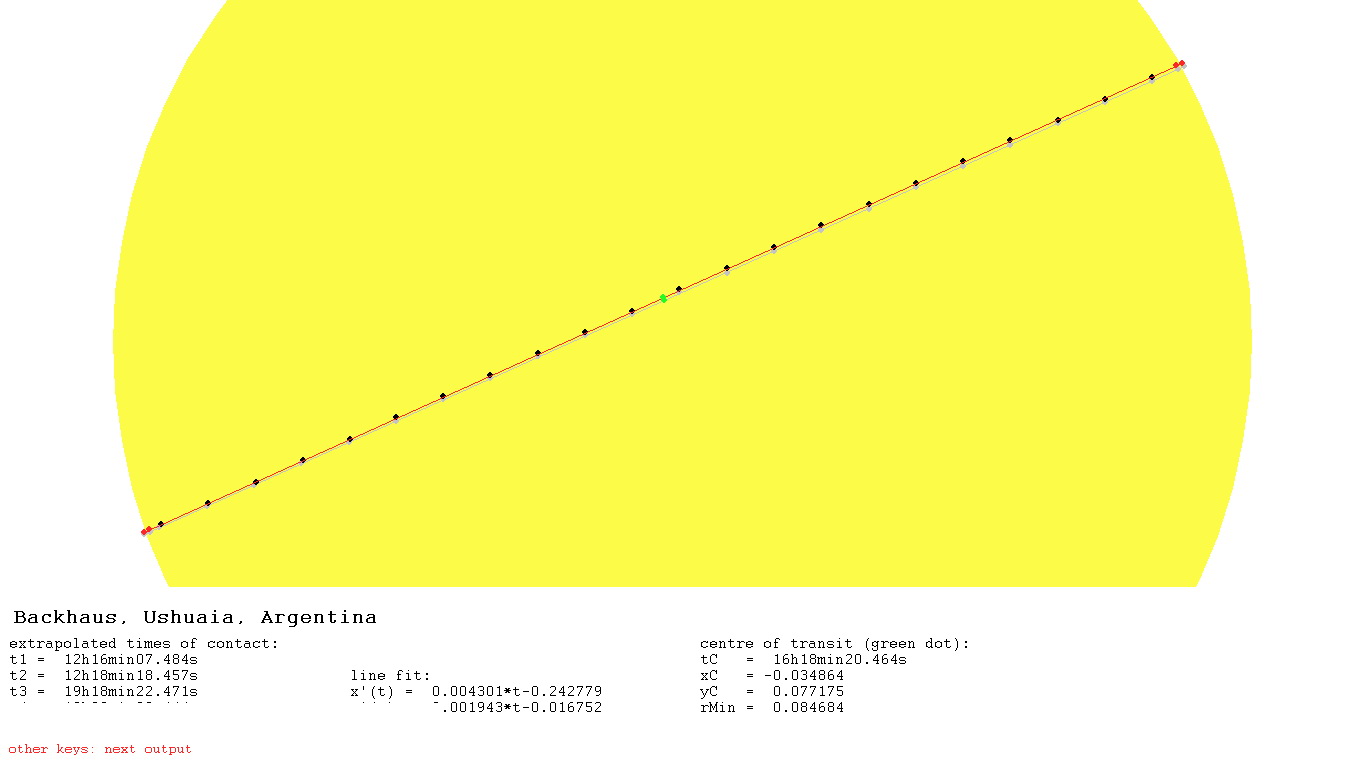
Simulated position measurements
from Ushuaia |
Comparison of both series |
In this way, we get to a considerably better measure of the solar parallax with an estimate of the confidence interval: πS=8.7"±0.2". The steps in the values are caused by the too little resolution of the simulated pictures: The sun has a radius of only 373px.
k.jpg)
Here positions have been used which have been derived from ephemerides calculated by JPL's HORIZONS system (Montreal(horizons).xls and Ushuaia(horizons).xls). If one calculates the 13:45:00 positions of Mercury with these measures the result is (with comp2Mercury2019positions.xls, for instance, or the (Windows-) program calcparallax2019) the result will be a solar parallaxe of πS=8.79" - a perfect result.
-
If you don't find any partner to compare your photos with you may compare your position measurements with the calculated
positions for the geocentre (These values can be calculated without knowing the AU!). The measures in Geocentre(horizons).xls have again been calculated with JPL's HORIZONS system.
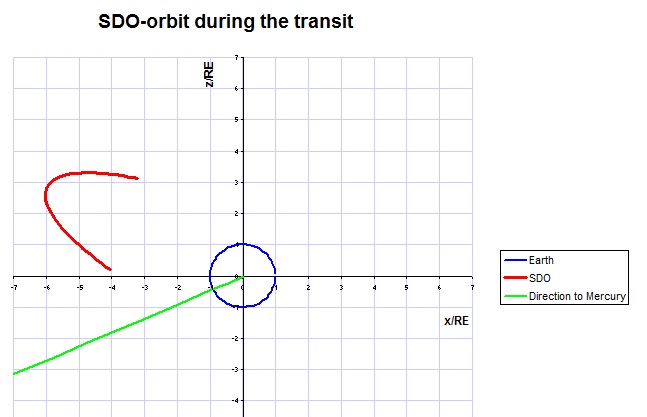
Another possibility will be the comparison with the images of NASA's Solar Dynamics Observatory (SDO). But for this method it is necessary, too, to be able to determine the orientation of the own photos (and most likely there will be no sunspots!).
This telescope is built in a satellite orbiting around the earth geosynchronously The radius of its orbit is about rSDO=6.61rE.
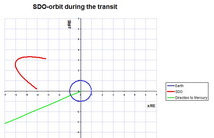
This telescope always has a "clear sky" and NASA will publish its transit photos immediately. For the determination of Mercury's position (x',y') the orientation of the SDO images (solar north pole above) must be taken into account.
The program evaltransitpicts can deal with single exposures of known angle of rotation and the utilities on the "Stuff" page comp2Mercury2019positions.xls and calcparallax2019) handle SDO positions correctly.
The geocentric coordinates of the satellite can be calculated with the HORIZONS system, too. We have put them on the "Stuff" page.
The Excel sheet comp2Mercury2019positions.xls contains one example of Mercury's position as seen by SDO. In the sheet that position can be compared with those which have been calculated for Montreal and Ushuaia.

|
|
Editor: |
Udo Backhaus
 |
last update: 2019-10-30 |

|
.bmp)
.bmp)
.bmp)
.bmp)
.bmp)
.jpg)
.jpg)